Verde River Institute
Verde River Photographic Monitoring
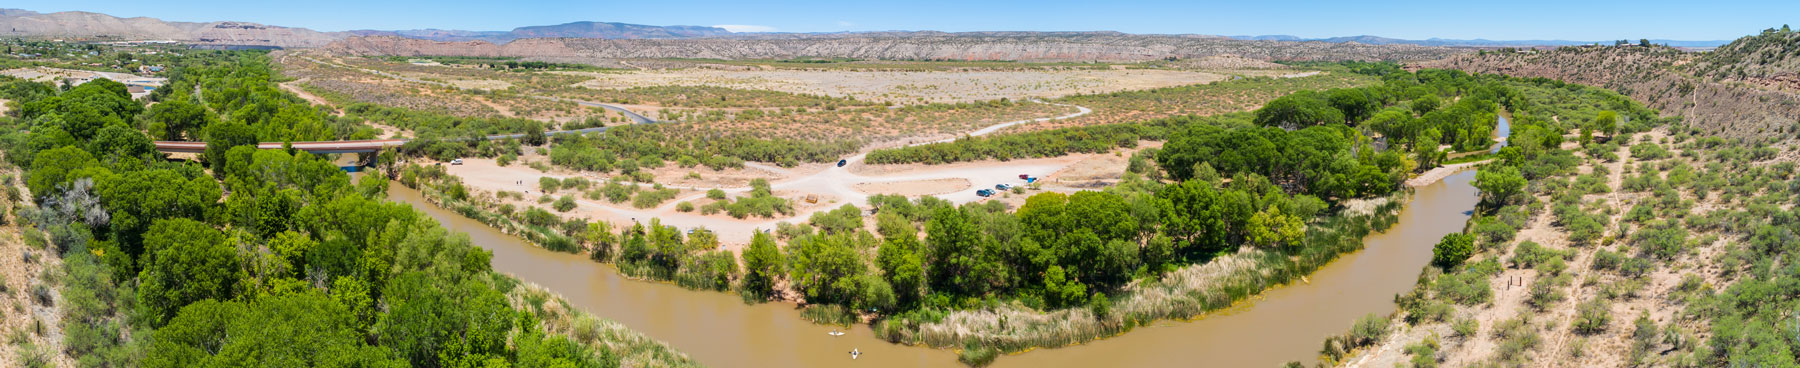
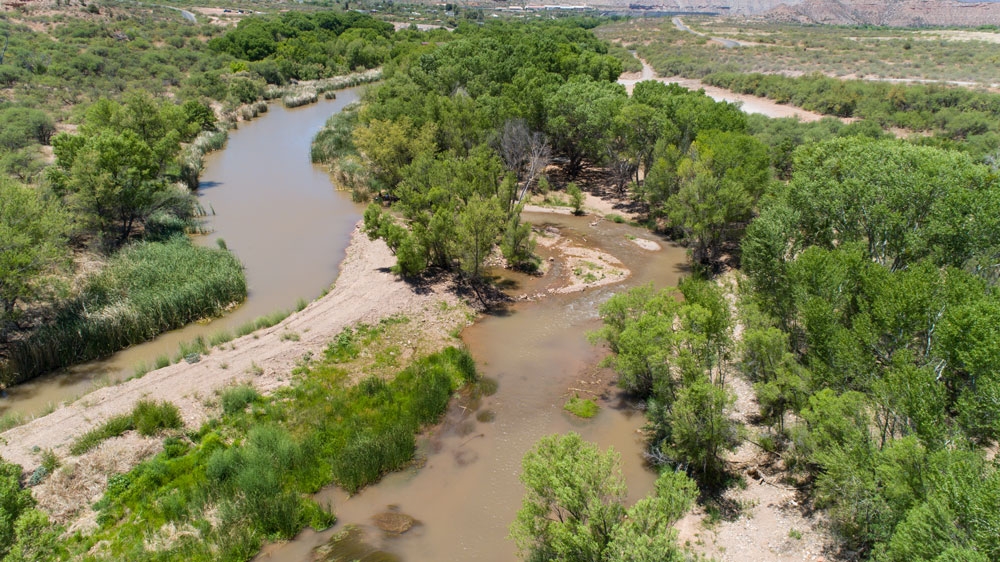
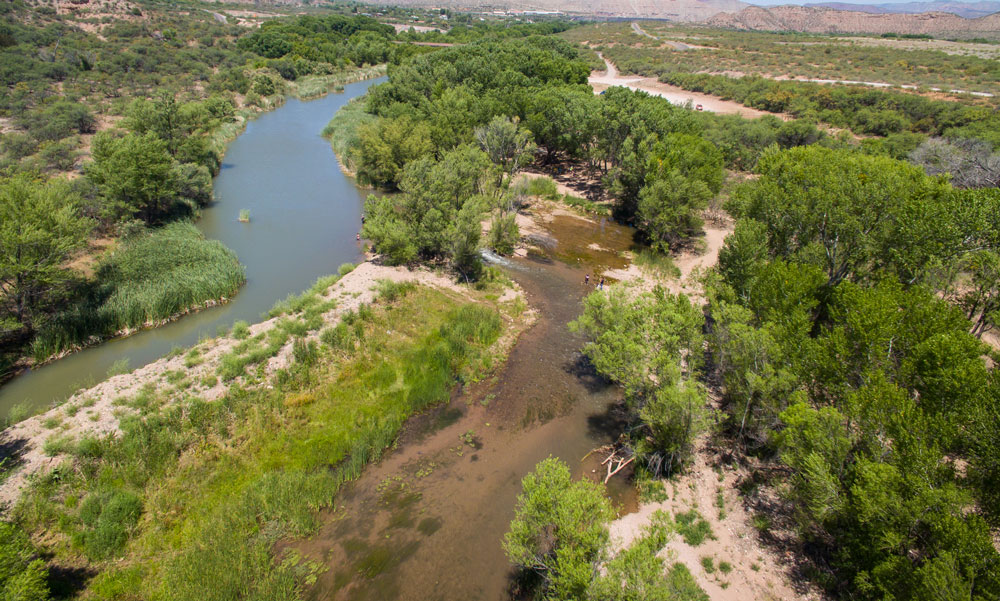
Together, these images give us a detailed record of how the river changes season to season, day to day, and how changes in flows manifest themselves in the river’s streambed. We also use these pictures to “calibrate” flows that are the result of runoff that does not register on the Clarkdale Gauge because they occur downstream of the gauge.
Photo monitoring is also used to understand how the river’s riparian vegetation grows, declines, spreads, etc. For instance, if we want to know when the first Arizona Alder leafed out in 2015, 2016, 2017 and 2018, we have those data. Is the cattail cover increasing, decreasing, or remaining constant? Just look at the images. Are trees dying earlier than they have in the past? Let’s check the photo library.
Photographic monitoring is, as they say, worth 10,000 words! If you need to see a particular day’s photos, just let us know.